GeoPerformance
for district heating
- Do you always have up-to-date and easy access to all the most important management and operational information of your company? Critical in areas such as:
- asset management
- overview of current processes
- monitoring the progress of tasks and projects
- billing control
- Is monitoring of the most important processes difficult due to the fact that information in specialized systems is presented selectively and you lack a broad overview?
- Performing collective analyzes and creating reports based on data from various sources is difficult, slow, and ineffective?
If you are familiar with these challenges, discover GeoPerformance for district heating

GeoPerformance for the heating industry
GeoPerformance integrates data from various sources and presents it in real time using intuitive dashboards and maps.
The most important information on one screen
The message is easy and clear, so you can focus on important issues and the cause of any problems and make quick and accurate decisions.
Improved management
Visual monitoring of key operational, management, and financial events in real time and with the support of a map facilitates the management of the heating network.
Convenience and reduced risk of errors
The ability to monitor and control devices with one application minimizes the risk of errors.
Discover the capabilities of GeoPerformance
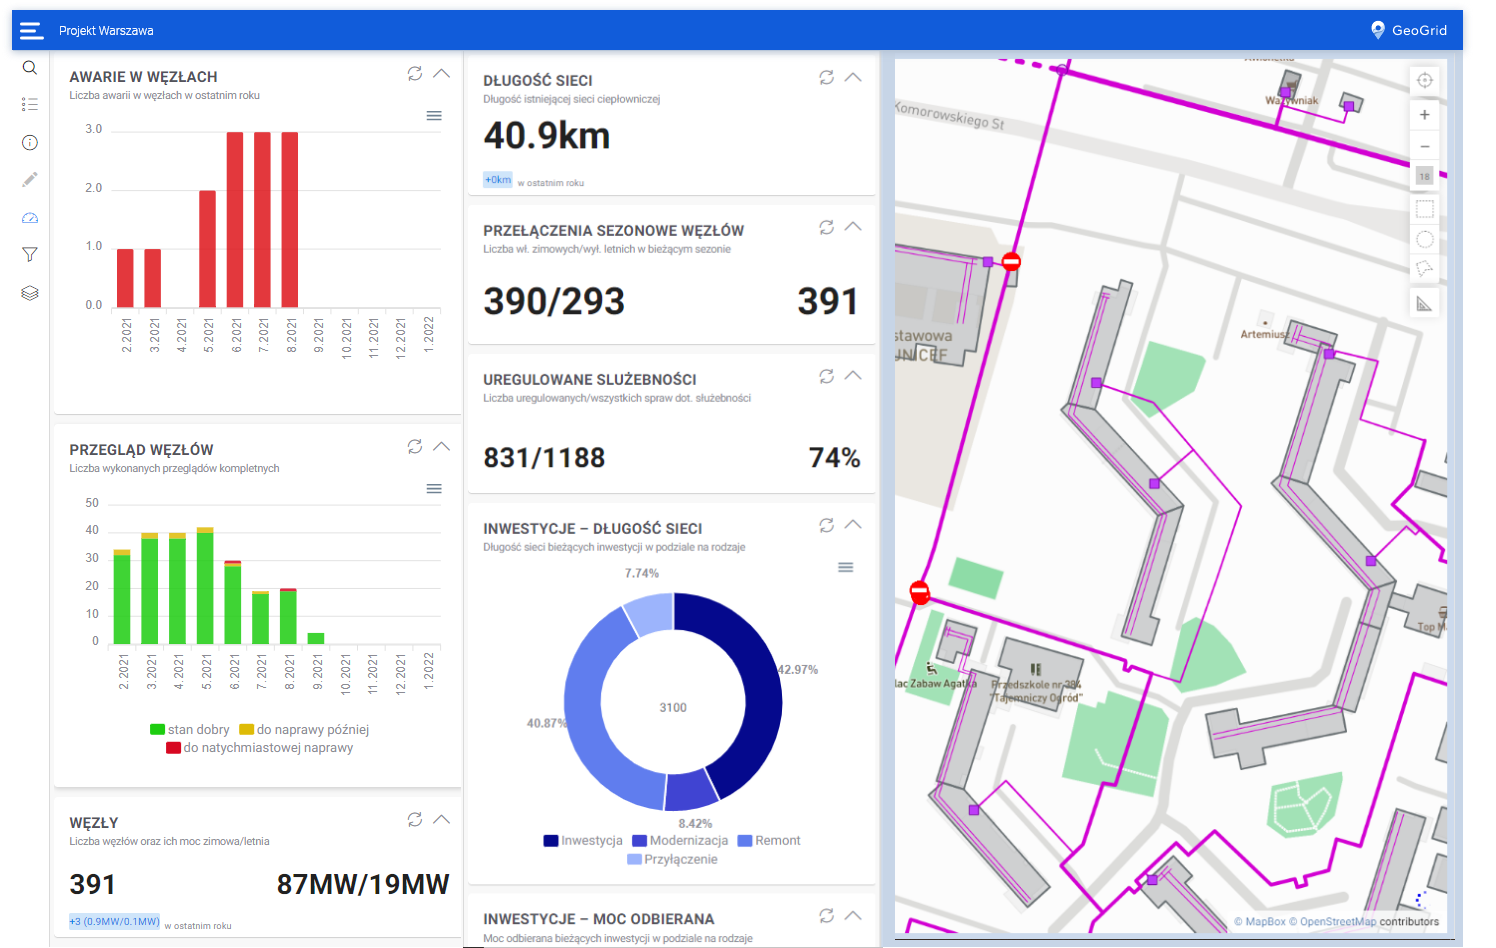
Management panels
Management panels help management track key performance indicators (KPI) and make decisions based on always-up-to-date information.
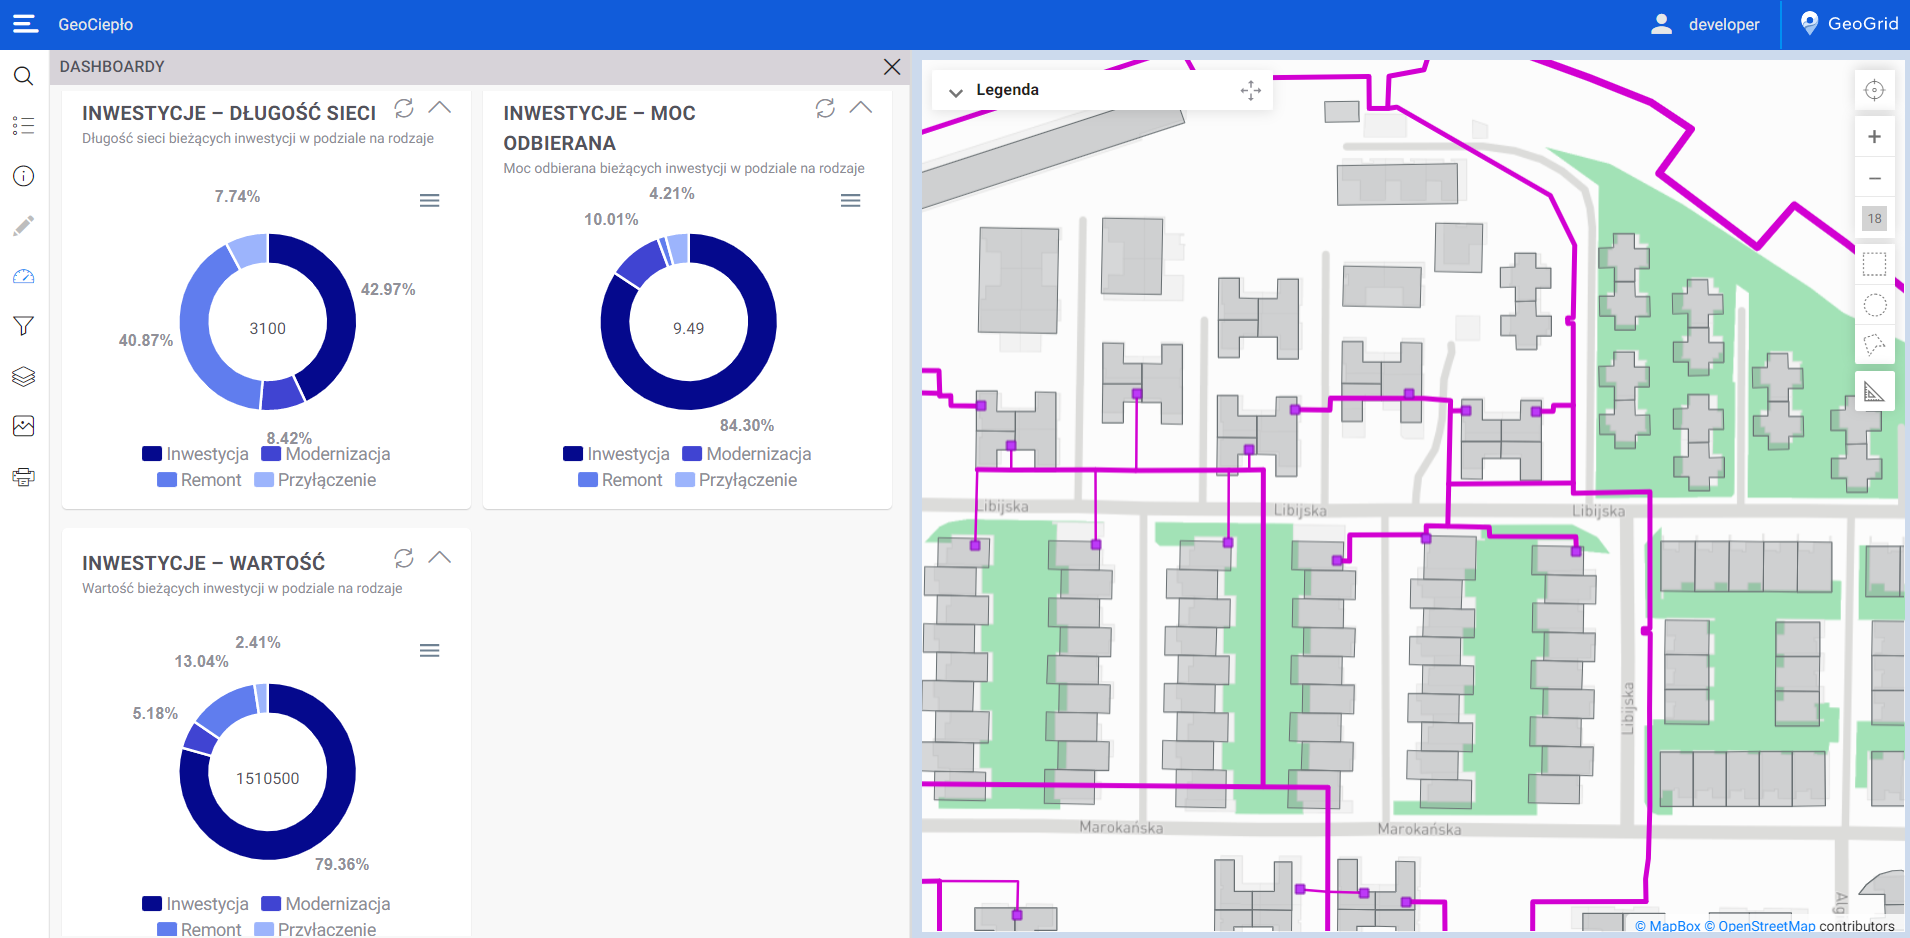
Panels allow you to improve management by visually monitoring key operational, management and financial events in real time and in a geographical context, on a map. These events include:
- failures
- reports
- projects and investments
- billing information
The panels clearly present trends, statistics and processes based on data from various systems.
Operational panels
Operational panels help operational department employees and dispatchers understand events and processes by monitoring their status in real time.
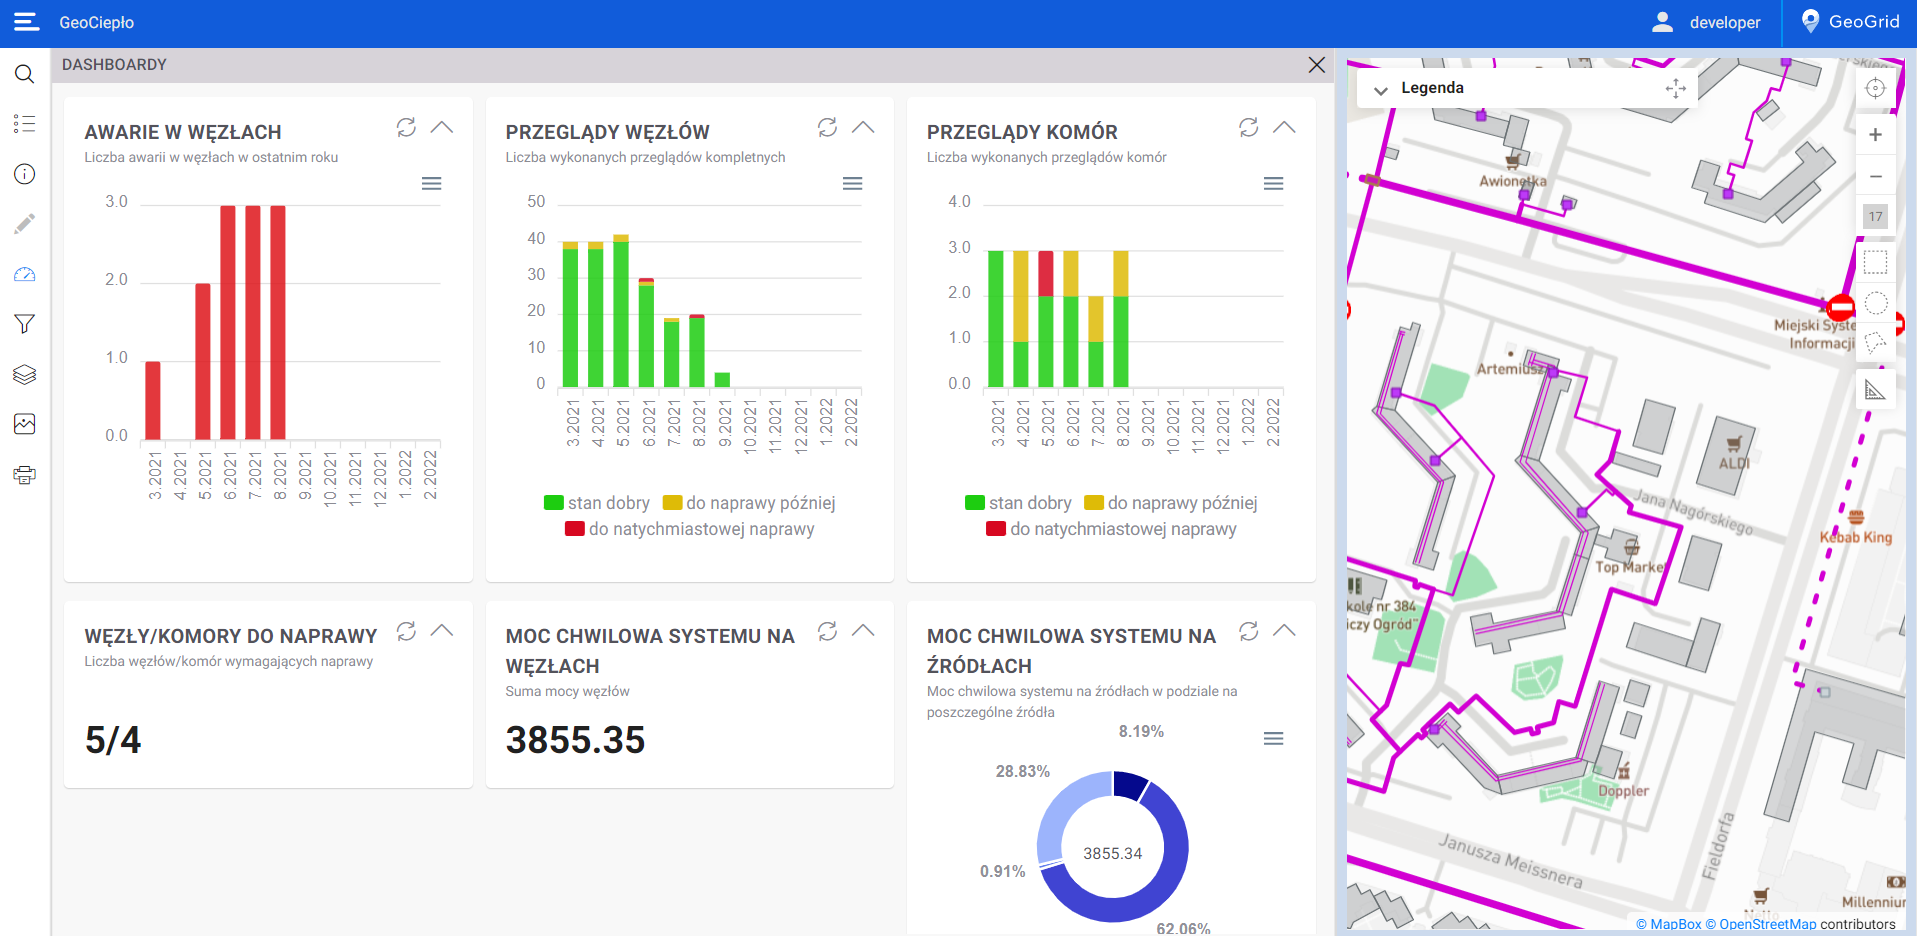
- Operational panels improve work through collective, visual monitoring of all operational events (failures, reports, readings, measurements) in real time and in a map context on one screen.
- Integration with other systems will make it possible to show processes/readings in appropriate contexts, e.g., telemetry data regarding a specific recipient and place of the network, not just a node.
- Operational panels allow you to make better and faster decisions thanks to the effective management of specific operational processes, e.g. failure reports or meter status.
- They allow you to reduce the risk of errors thanks to the ability to monitor and control devices using one application.
- They are comfortable and intuitive to use.
Explore other GeoPerformance features
District heating data model
- Heating network, buildings: sources, chambers, heat distribution centers, devices
- OSM street map
- Geoportal maps
- Land and buildings registry
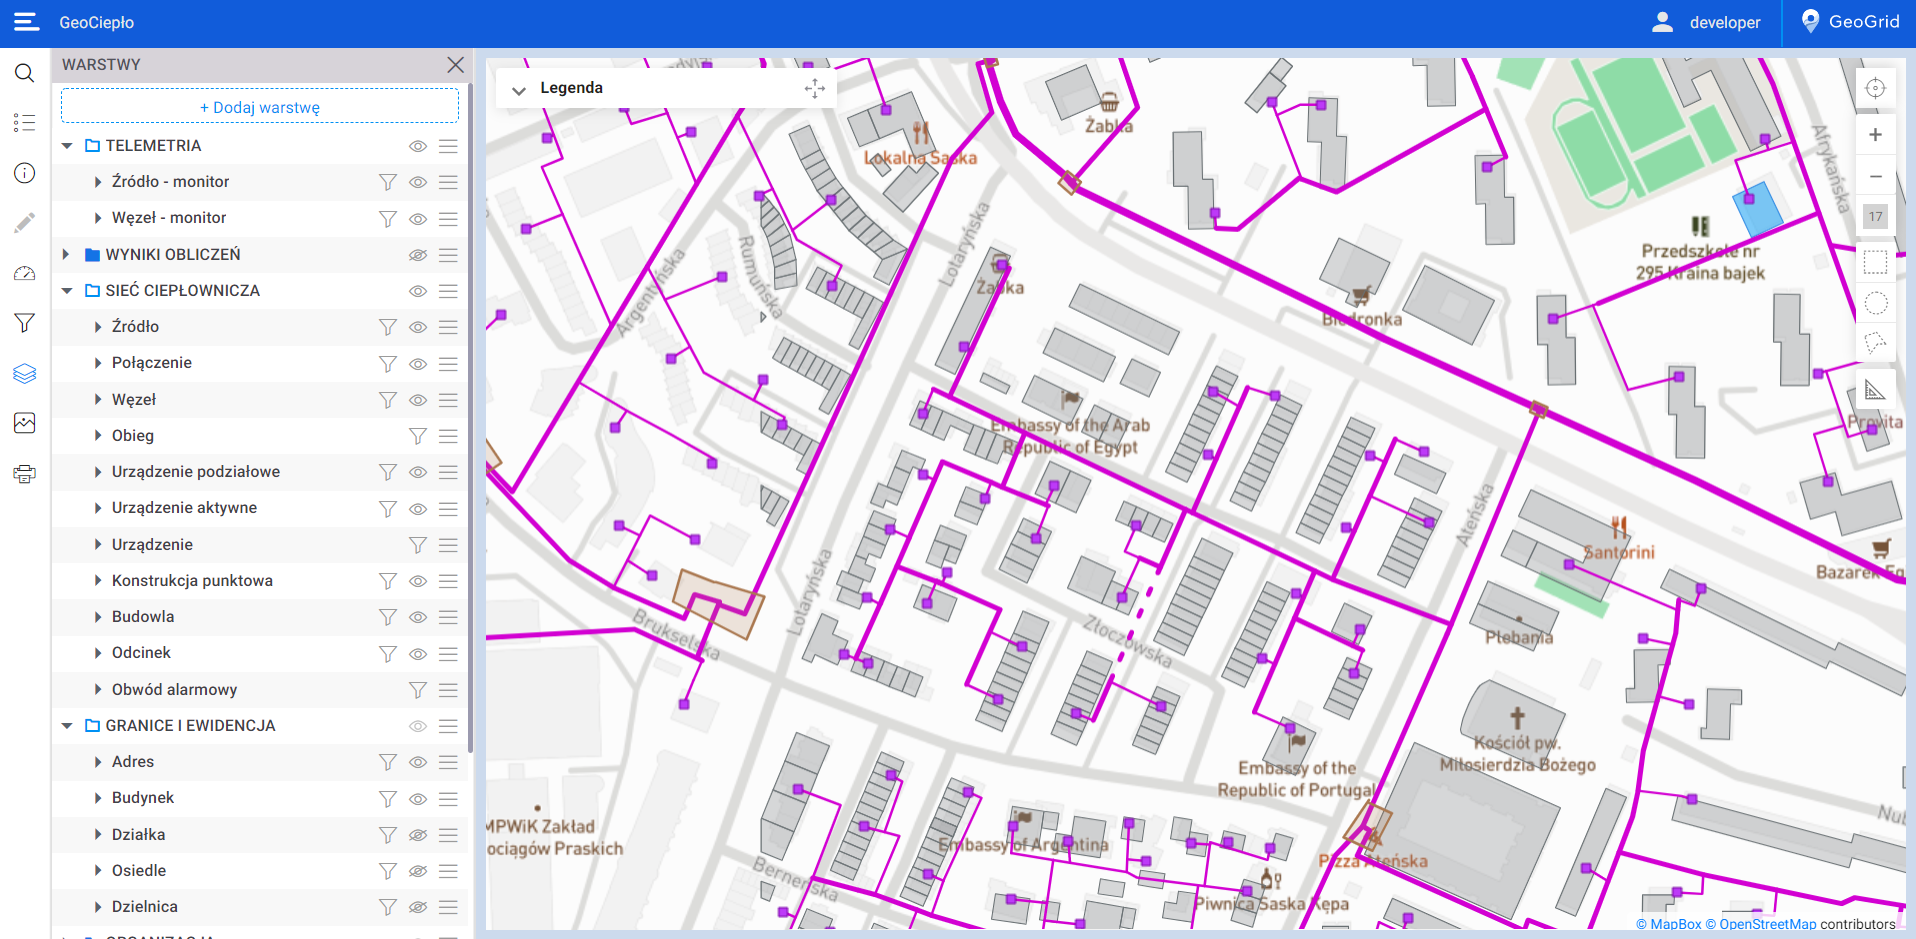
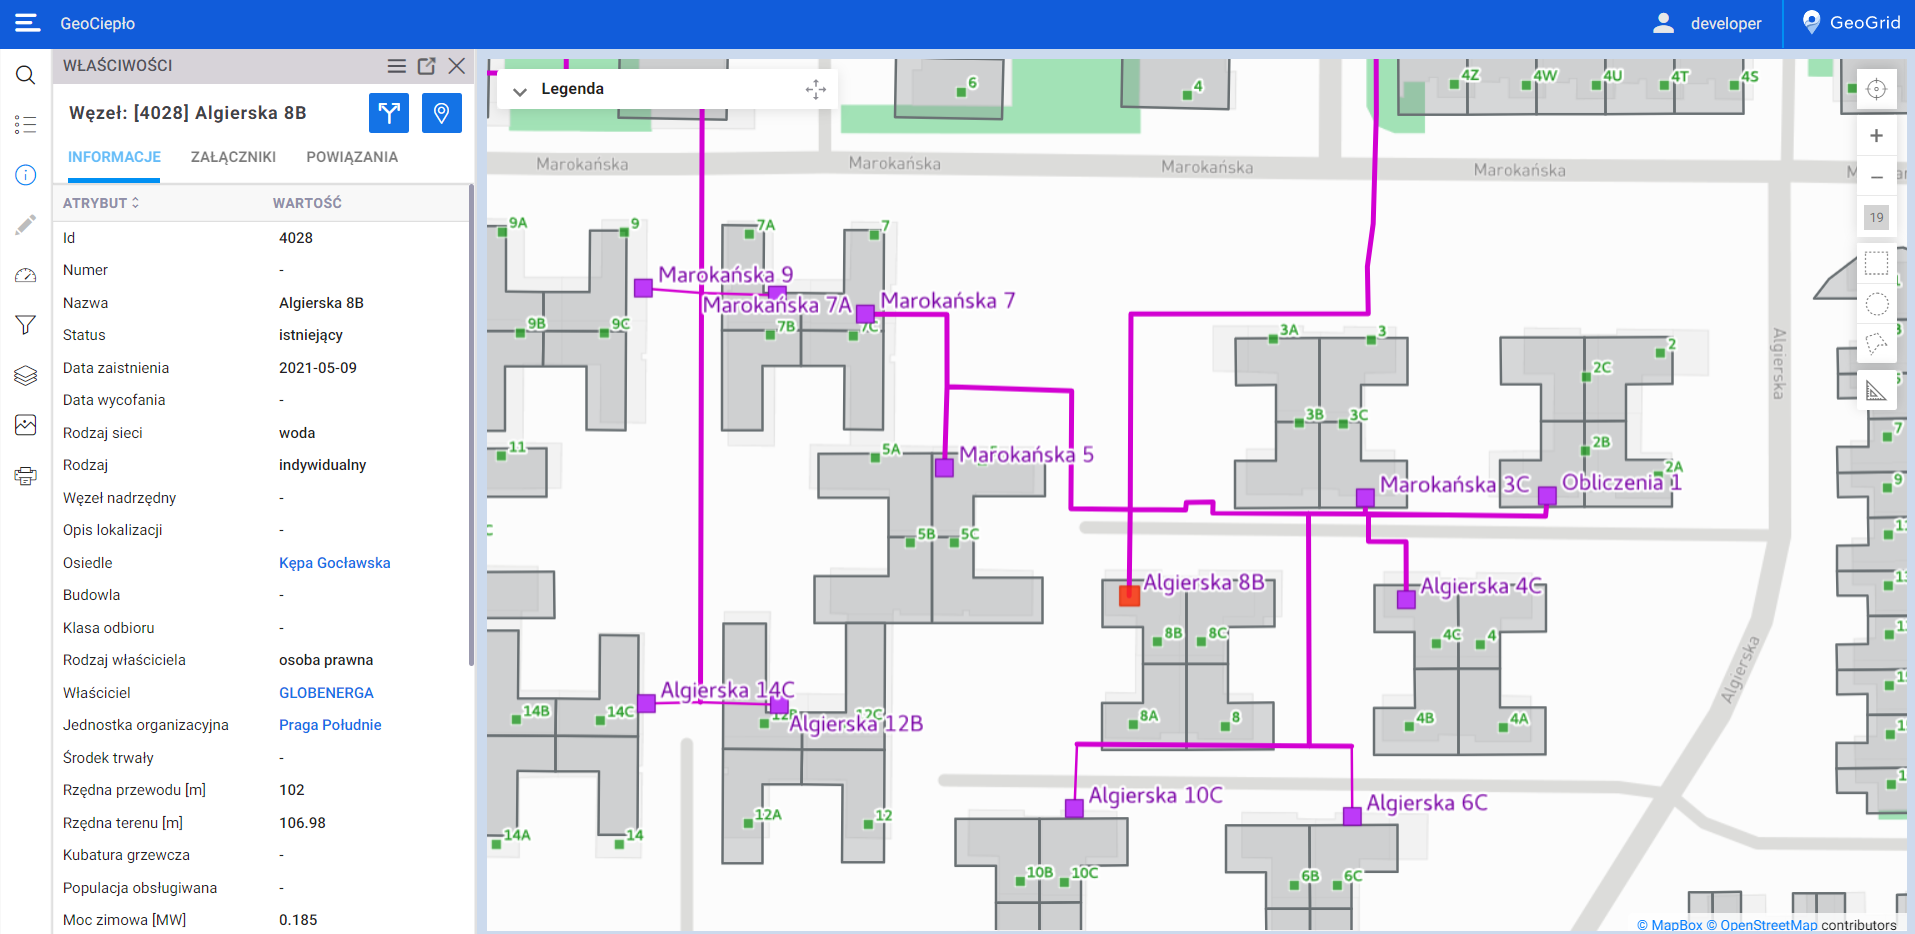
Interactive visualization of the network on a map and access to object properties
Monitor and manage network processes thanks to visualization of:
- measurements at nodes
- emergencies on nodes
- inspections of nodes and chambers
- shutter switching
- process progress
- object statuses
- investments that are in progress or planned
- information from the billing system (on overdue payments)
- information from the ERP system on infrastructure depreciation
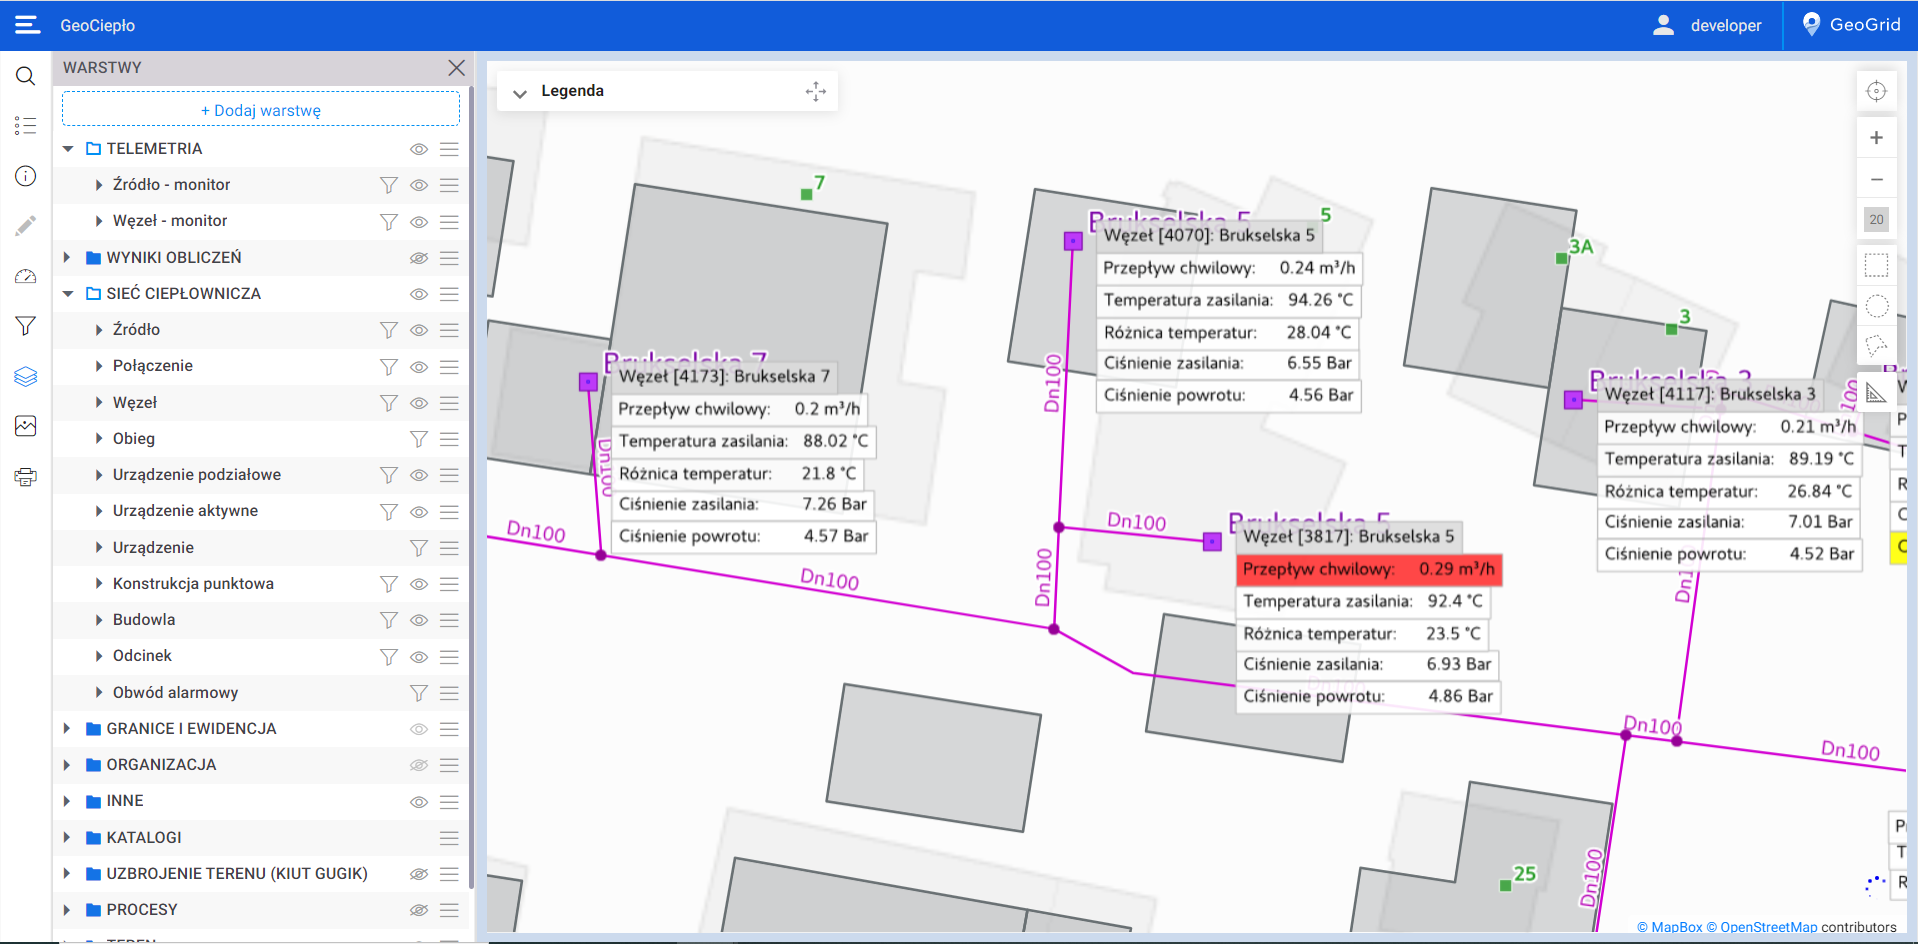
Telemetry readings and alerts on the map
- Quickly changing indicators and labels presenting data in real time
- Visual representation of exceeded border values, e.g. temperatures and pressures
- Access to extensive properties of objects integrating fast-changing data
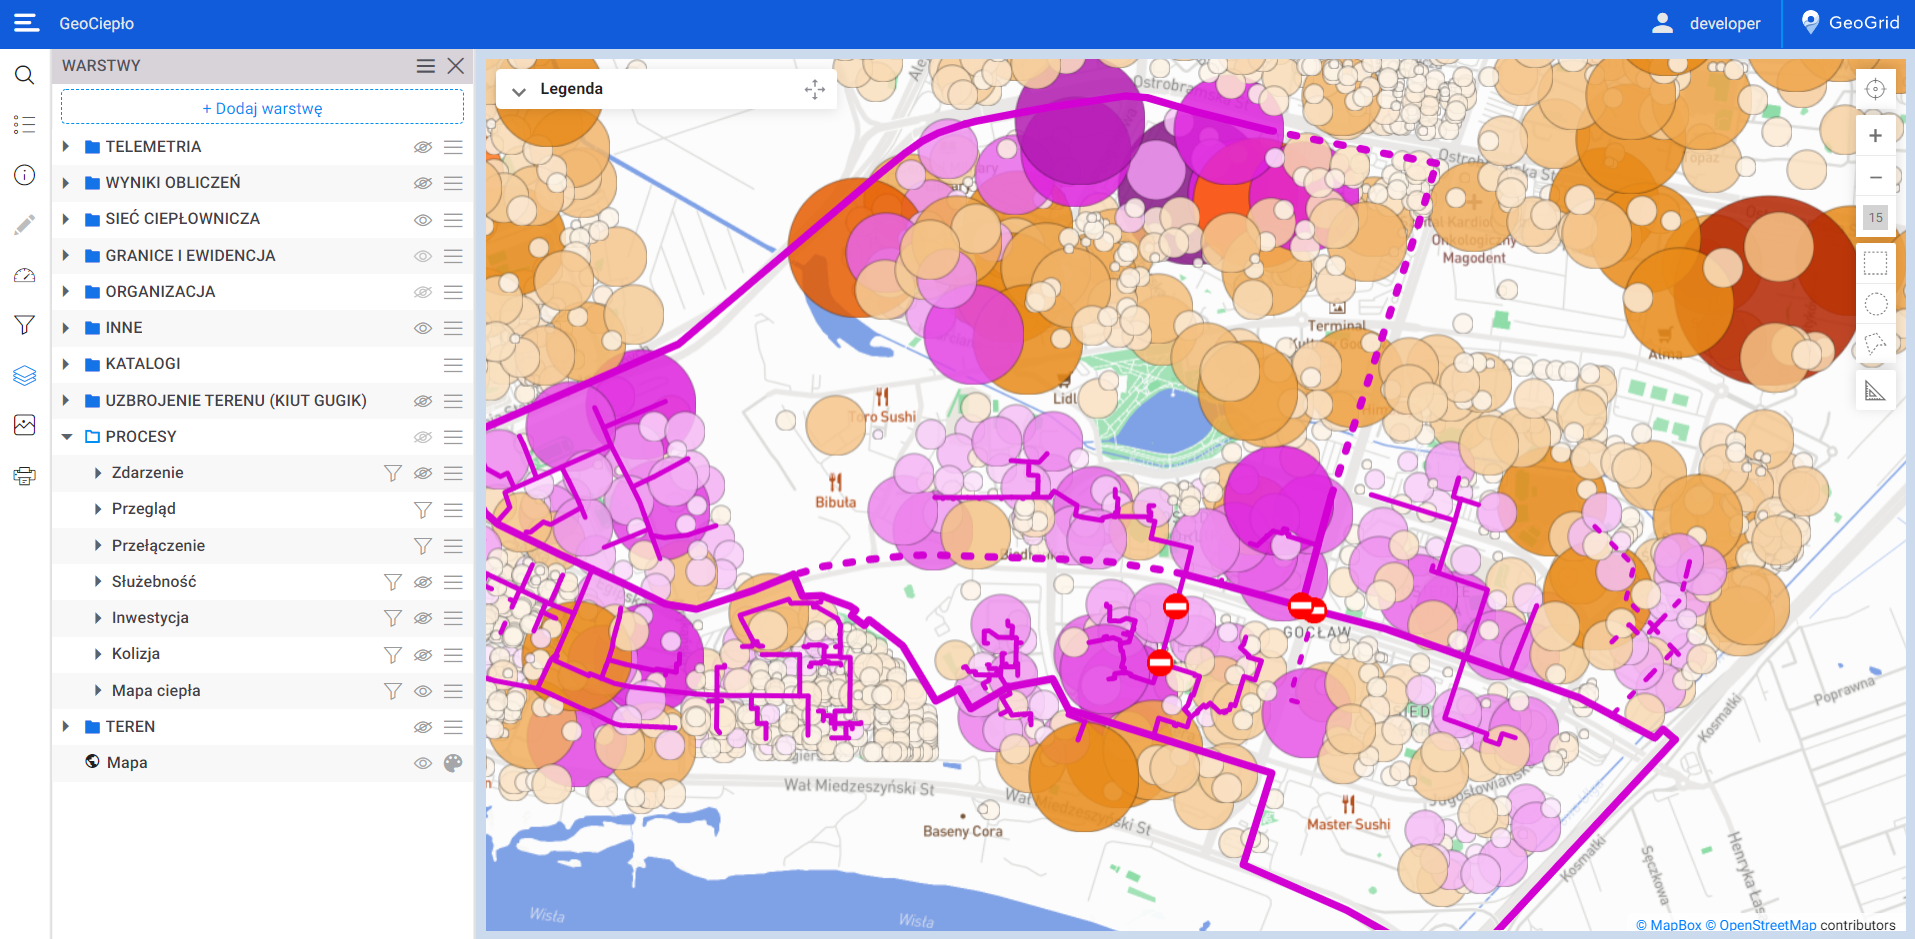
Process visualization
Using GeoPerformance, you can present switching on and off, heat demand or thermal imaging measurements on a map.
- View of the progress of switching on/off – e.g. based on GeoTask – Field Service Management solution for managing field works
- View of the thermal demand of buildings (building volumes)
- Visualization of failure points and unpowered areas
- Thermal imaging measurement layer – heat losses
Find out what benefits GeoPerformance can bring you
With GeoPerformance, you gain reliable and always up-to-date information on project progress and can easily identify bottlenecks.
What does this mean in practice?
Timely completion of work performed on the network
Quick responses to failures and unexpected events involving the network
Ongoing adjustments to plans and risk management
What else does GeoPerformance offer?
A system in the cloud or on-premises
Flexibility of implementation – in the cloud (no hassle with hardware, IT infrastructure and maintenance) or on-premises.
Integration with systems
An easy integration and processing of data from various systems, thanks to the popular FME Platform, such as:
- Telemetry
- SCADA
- ERP, Billing Systems
- GIS
Access and data security
Daily backups, ability to export all data to SHP.
Intuitive use
Easy use of the browser and mobile application thanks to a friendly, transparent interface.
Our Customers


Our experience
Why is it worth working with us?
Experience
We have 25 years of experience in creating and implementing geospatial applications, from simple map applications to advanced GIS systems.
Customers
Over 800 companies from all over the world have already used Globema’s solutions.
Integration with other systems
We support integration with various systems of your company, including GIS systems, we offer support in acquiring, transforming, and integrating data based on the FME Platform.
Employees and implementations
Our geospatial systems specialists collectively have over 200 years of experience in creating and implementing mapping applications in many places around the world.
”MPEC Rzeszow Sp. z o.o. field services and employees of the Heat Emergency Service or the Operations Department, thanks to mobile devices equipped with GeoGrid tools, using Google Maps, have easy and quick access to full information on the heating infrastructure, collected in the core EC.GIS system.
Adrianna ChmuraHead of the GIS Department, MPEC Rzeszów Sp. z o.o.


